How to Journal with Volume
The difference between traders who improve and traders who repeat the same mistakes? The ones who improve write things down.
A trading journal isn't just a log — it's a mirror. It shows you patterns you can't see in the moment: the setups that actually work for you, the emotions that lead to bad decisions, the times of day when you trade best.
Volume has a built-in journal designed specifically for this. After every trade, you can capture what you were thinking, what the market was doing, and what you learned — all linked directly to your trade data.
Let's walk through how to use it.
Why Journaling Matters
Trading without data is gambling. Here's why journaling changes everything:
-
Data compounds. Ten journal entries give you hints. Fifty give you patterns. Two hundred give you statistical confidence. Every entry you add makes your entire dataset more valuable — not just by one, but exponentially. The traders who journal longest have the biggest edge.
-
Feelings lie, data doesn't. You might feel like breakout trades work better for you. But does your actual win rate on breakouts agree? Without data, you're trading on vibes. With data, you're trading on evidence.
-
Small edges multiply. Discovering that your win rate jumps when you wait for volume confirmation doesn't sound dramatic — until you realize that edge applies to every future trade. Data-driven adjustments compound just like returns do.
The journal isn't homework. It's the raw material for every improvement you'll ever make as a trader.
Accessing the Journal
There are two main ways to get to your journal:
- From the sidebar: Click Journal and Stats in the left navigation (marked with a "NEW" badge), or go directly to
/journal. - After closing a trade: A popup prompts you to journal the trade you just closed (more on this below).
When you have no entries yet, the journal page shows an empty state instead of your stats and filters — head to the dashboard and close your first trade to populate it.
Creating a Journal Entry
From the post-close popup
Whenever you close a position — whether you clicked the row's close icon, or a stop loss, take profit, or expiration closed it for you — a popup appears in the top-right corner of the gameroom summarizing the result:
- Win — a green "Trade Won" popup with a profit icon and the P/L shown in green (e.g. "SPY +$12.93").
- Loss — a red "Trade Lost" popup with the P/L shown in red.
- Break even (exact $0.00 P/L) — a grey "Break Even" popup with a minus icon.
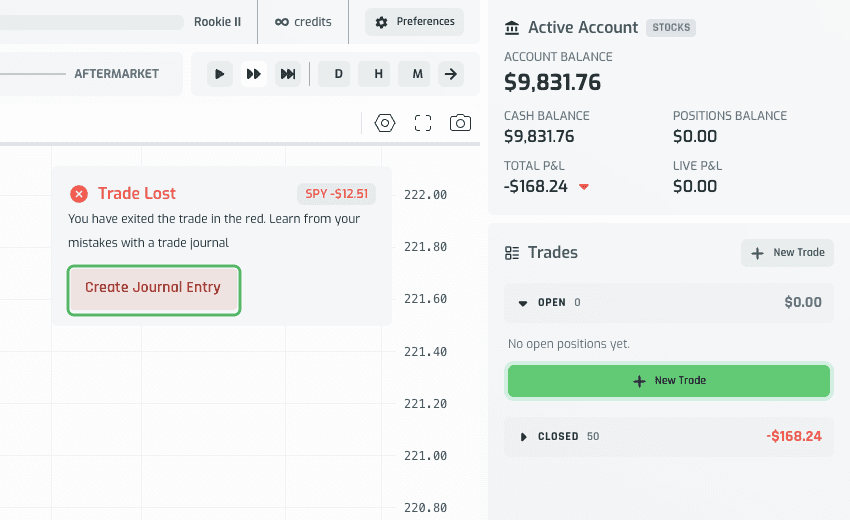
Click Create Journal Entry on the popup to open the journal form.
The popup auto-dismisses after about 7 seconds if you don't act on it. If you miss it, close another trade to get a fresh one, or journal the trade from the Closed positions list (see below). If you close several trades in quick succession, only 3 result popups show at once — the rest wait their turn and appear as the visible ones finish their window, so you never lose track of a result.
From the Closed positions list
You don't have to catch the popup. In the gameroom's Trades panel, expand the Closed tab — each closed trade row shows either Add Journal (no entry yet) or Edit Journal (an entry already exists) in the Journal column. Click it to open the same journal form for that trade.
Filling out the form
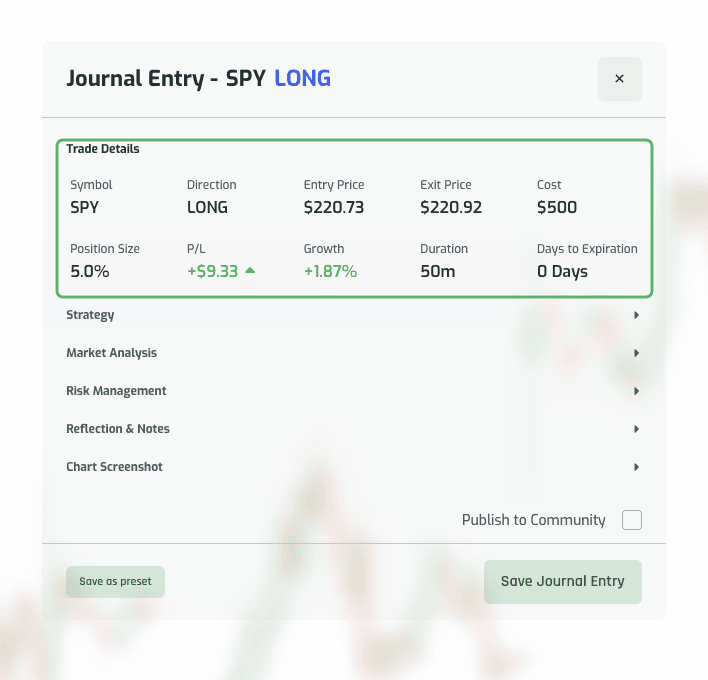
The Trade Details section at the top is automatically populated from the trade you closed and can't be edited — it's the objective record of what happened:
| Field | Description |
|---|---|
| Symbol | The ticker you traded (e.g., SPY) |
| Direction | LONG or SHORT |
| Entry Price | Price when you opened the position |
| Exit Price | Price when you closed |
| Cost | Total dollar amount invested |
| Position Size | Percentage of account used |
| P/L | Profit or loss in dollars |
| Growth | Percentage return |
| Duration | How long the position was held |
| Days to Expiration | Expiration setting used |
Below that are five collapsible sections. None of them are required — you can save with just the auto-filled Trade Details, or expand any of them to add more context:
Strategy — pick a saved Trading Strategy (or add a new one), a Trade Type (Breakout, Reversal, Pullback, Momentum, Scalping, or your own), the Indicators Used (Moving Average, RSI, MACD, Bollinger Bands, Volume, Fibonacci, Stochastic, ATR), and your Entry Confirmations (Chart Pattern, Support Level, Resistance Level, Indicator Signal). Consistent naming here lets you filter and analyze by strategy later.
Market Analysis — tag the Market Direction (Bullish/Bearish/Neutral) and Market Volatility (Volatile/Quiet/Consistent), your Short-Term Bias and Long-Term Bias, plus Market Volume, Entry Timing, and Time Frame.
Risk Management — your Reward Ratio, Management Style (Fixed Stop Loss, Trailing Stop, Break Even, Greedy, Conservative, Aggressive, Fearful), and the Stop Loss / Take Profit values you used.
Reflection & Notes — the most important section. A free-text Trade Summary & Learnings box (1,000 character limit) for your thesis, what worked, and what you'd change — plus a set of toggleable Trade Attributes to tag how you traded: positive ones like Disciplined, Patient, Calculated, and Stuck to Plan, and negative ones like FOMO, Revenge Trading, Overconfident, Fearful, Impulsive, and Deviated from Plan.
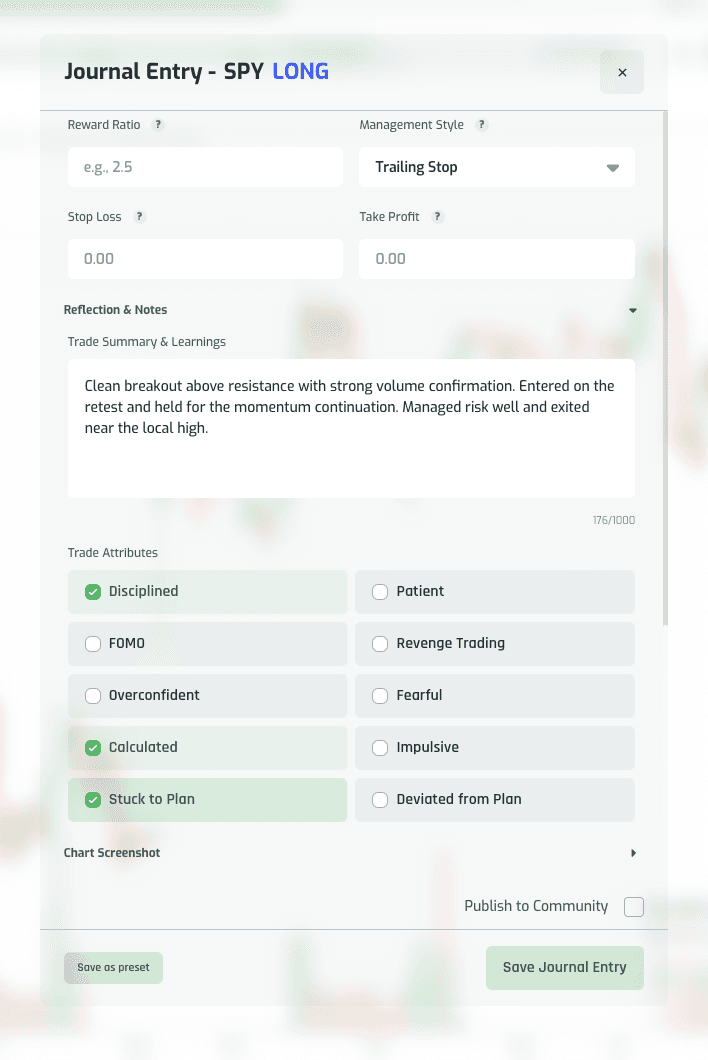
Be honest — the journal is for you. After enough trades, patterns emerge: maybe "Impulsive" tags cluster on losing trades, or "Patient" correlates with your biggest winners.
Chart Screenshot — click Capture Current Chart, then confirm with the Capture Chart button that appears. The current chart view attaches as a preview, with Re-Capture and Remove options if you want to redo it.
Saving
At the bottom of the form:
- Publish to Community — check this to share the entry on your public profile. Leave it unchecked to keep the entry private (see Publishing to Your Profile below).
- Save as preset — save your current Strategy/Market Analysis/Risk Management fields as a reusable preset (see Strategy Presets below). Only available on brand-new entries.
- Save Journal Entry — saves the entry. A "Journal entry created successfully" toast confirms it, and the modal closes.
The entry immediately appears in your journal list with your stats updated.
The Journal Page
Visit Journal and Stats in the sidebar (or /journal) to see all your saved entries.
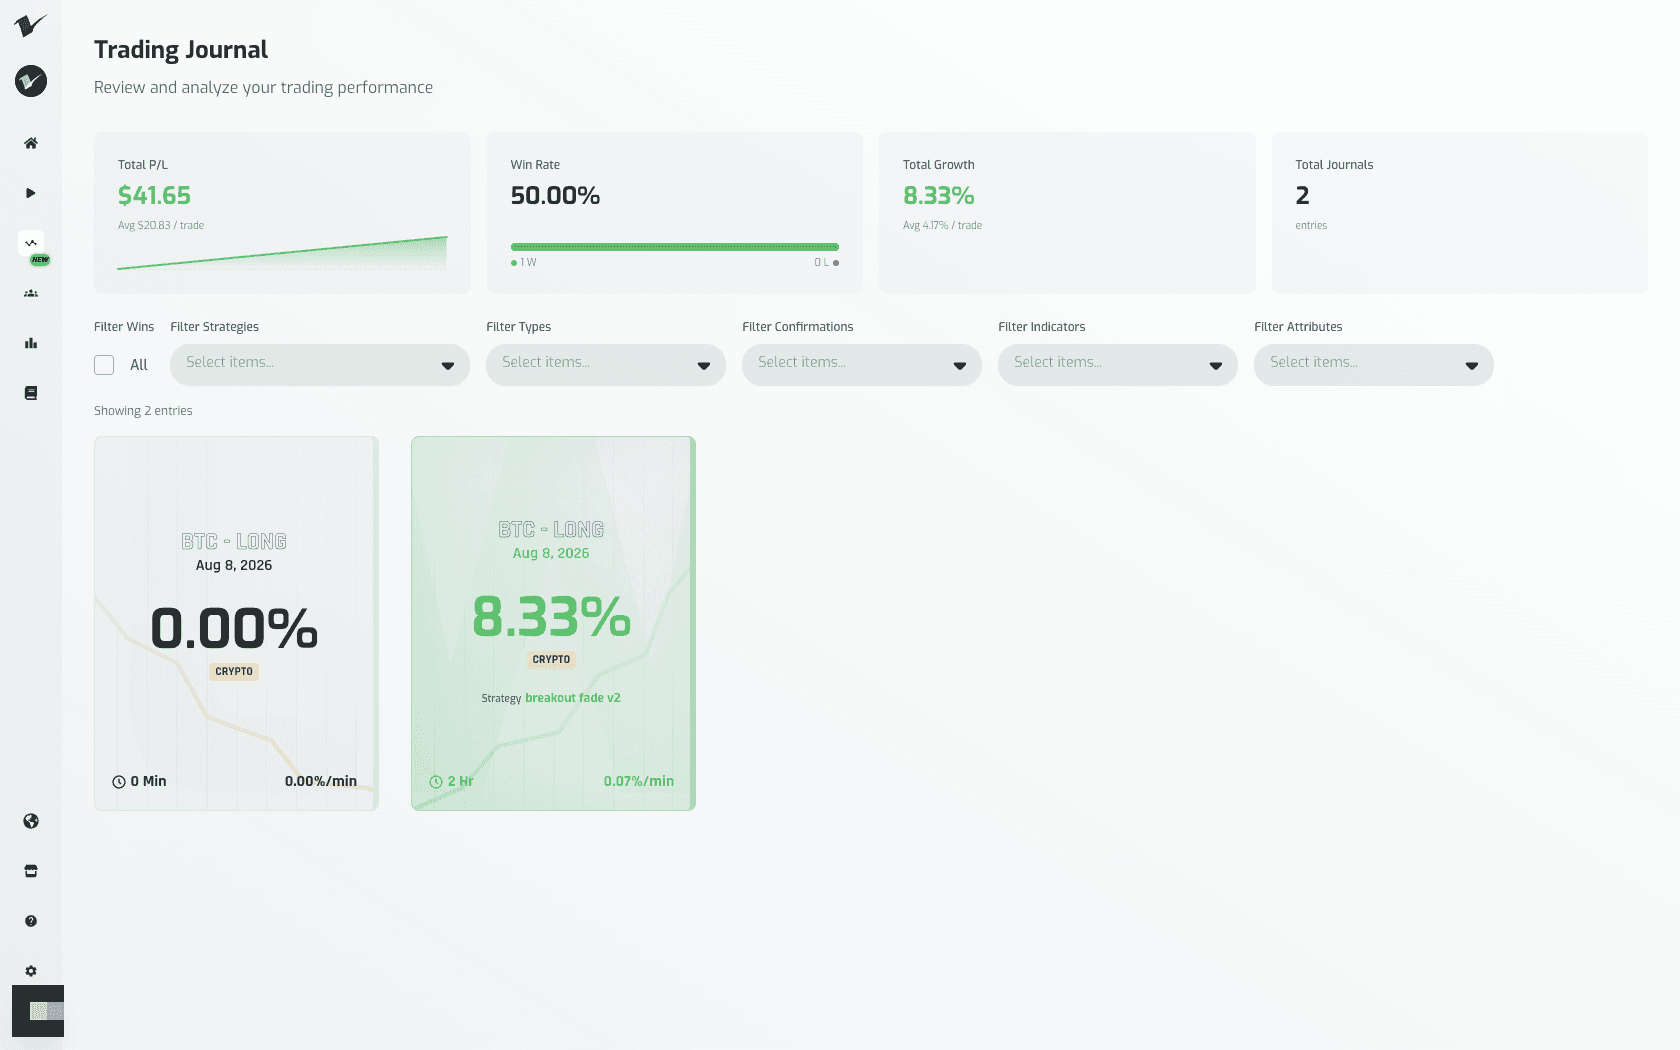
Stats
At the top of the page, four stat cards always reflect whatever entries are currently visible below — they update live as you apply filters:
| Stat | What It Tells You |
|---|---|
| Total P/L | Combined profit/loss across the visible entries |
| Win Rate | Percentage of visible entries that were profitable |
| Total Growth | Cumulative percentage return across the visible entries |
| Total Journals | Number of entries matching your current filters |
Your entries
Below the stats, each journaled trade appears as a card showing symbol/direction, date, growth %, market badge, strategy (if you set one), duration, and $/min rate.
Filters
Use these to slice your data and find patterns:
| Filter | Use It To... |
|---|---|
| Filter Wins | A single control you click to cycle through All → Wins → Losses → All |
| Filter Strategies | Compare performance across your named strategies |
| Filter Types | See which trade types work best: Breakout, Reversal, Pullback, Momentum, Scalping |
| Filter Confirmations | Find which entry signals are most reliable: Chart Pattern, Support/Resistance, Indicator Signal |
| Filter Indicators | Discover which technical tools correlate with wins |
| Filter Attributes | Identify psychological patterns — do "Patient" trades outperform "Impulsive" ones? |
Filter Strategies, Filter Types, Filter Confirmations, Filter Indicators, and Filter Attributes are multi-select dropdowns: click one, check as many options as you like, then click elsewhere (or press Escape) to close it. Selected options appear as removable chips inside the dropdown — click the small "×" next to a chip to remove just that filter. Combine filters freely — e.g. Wins + a specific Strategy — to narrow down to exactly the trades you want to review. The list and the "Showing N entries" counter update immediately with every change.
Viewing, editing, and deleting an entry
Click any journal card to open its full detail view in a modal, showing Performance, Trade Details, Strategy, and Market Analysis. From there:
- Click Edit (bottom left) to switch to the editable form. Some sections start collapsed — click a section's heading to expand it. Make your changes and click Save Changes to update the entry (a "Journal entry updated successfully" toast confirms it) — entries can be edited at any time after they're saved.
- Click Delete to remove the entry. A confirmation panel appears — "Delete Journal Entry? This action cannot be undone." — with Cancel and Delete buttons. Click Cancel to back out, or click Delete again to confirm; you'll see a "Journal entry deleted successfully" toast and the entry disappears immediately, with the stat cards recalculating.
Strategy Presets
If you trade the same setup repeatedly, presets let you save your Strategy section (Trading Strategy, Trade Type, Indicators Used, Entry Confirmations) once and reapply it to future entries with a click, instead of re-filling the same fields every time.
Saving a preset
While journaling a trade, expand the Strategy section and fill in your Trading Strategy, Trade Type, Indicators, and Entry Confirmations. In the modal footer, click Save as preset, type a name (up to 40 characters) in the inline field that appears, and click Save (or press Enter). A success toast confirms it, and the preset is automatically selected on the entry you're working on.
Applying a preset
Once you have at least one saved preset, a Presets dropdown trigger appears in the footer of every new journal entry.
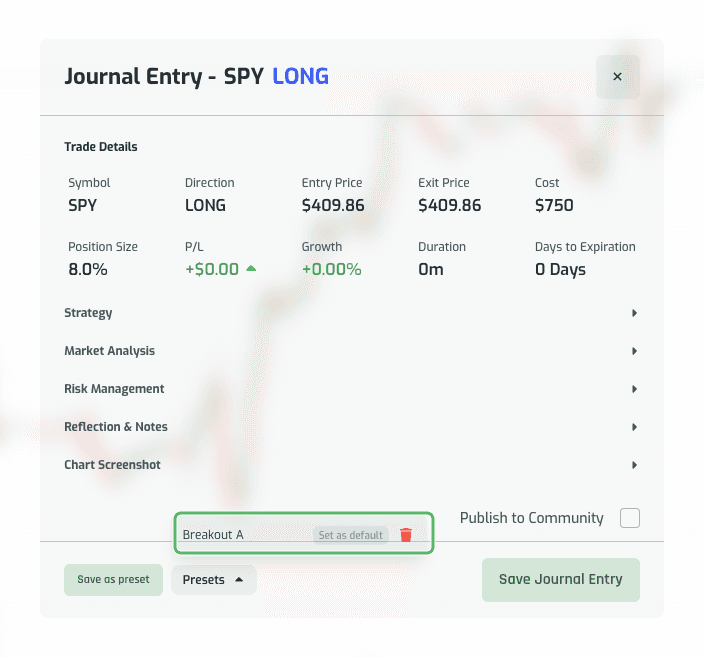
Click the dropdown trigger (it opens upward from the footer), then click a preset's row to apply it. This fills only the four qualitative Strategy fields — your Trade Details (symbol, prices, cost, P/L, growth, duration) always reflect the actual trade you're journaling. Once a preset is selected, Save as preset hides and a small X appears to the left of the dropdown trigger — click it to detach the preset without changing any of the values you've entered; Save as preset then reappears.
Setting a default preset
Open the Presets dropdown and click a preset row's Set as default tag — it highlights and now reads Default. From then on, every fresh journal entry (a new trade with no prior preset picked) auto-applies that preset's fields automatically, with no clicks needed. To stop auto-applying, open the dropdown and click the highlighted Default tag again.
Overwriting or deleting a preset
To update a preset's values, fill the Strategy section with your new values, click Save as preset, and save using the exact same name as an existing preset — its values are replaced. To delete one, open the dropdown and click the trash icon on a preset's row; it turns into a Confirm? tag — click it again to permanently delete, or click elsewhere to cancel.
Note that presets only apply to brand-new entries. When you edit an existing journal entry, the Strategy section still shows its saved values, but no preset controls appear in the footer.
Publishing to Your Profile
Any journal entry can be shared publicly by checking Publish to Community before you save it.
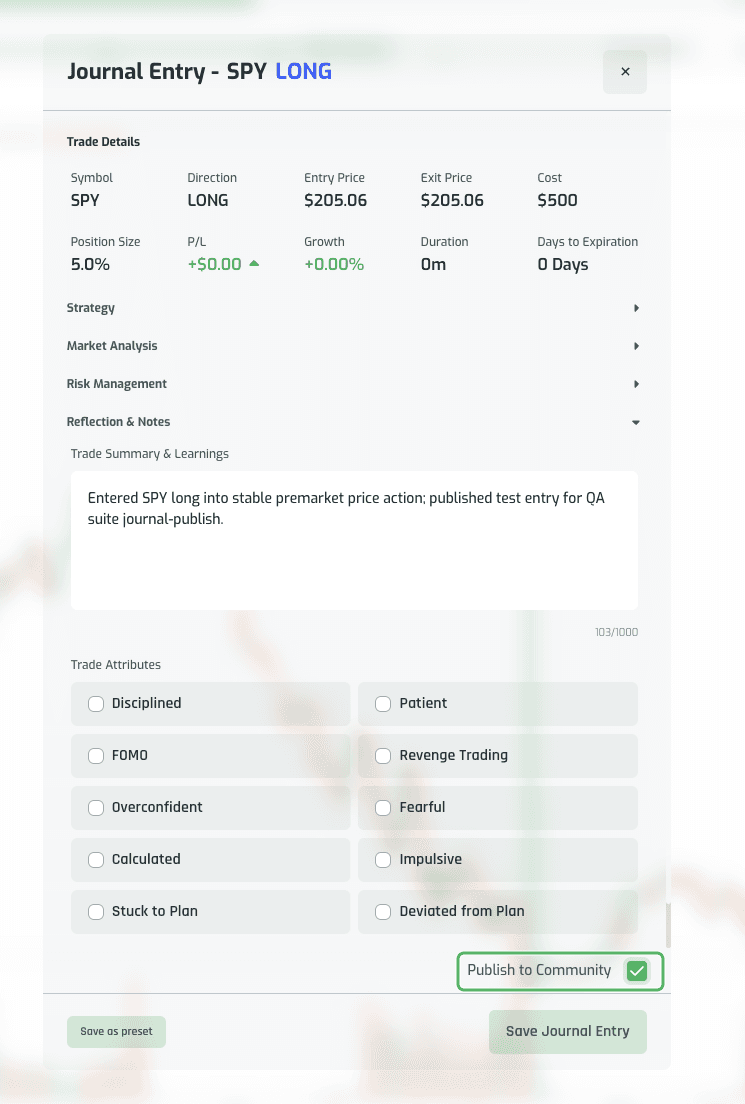
Published entries appear in the Trading Journal section of your public profile at /profile/<your-username>, most recent first, showing symbol, direction, market, date, growth %, and your reflection note as a preview.
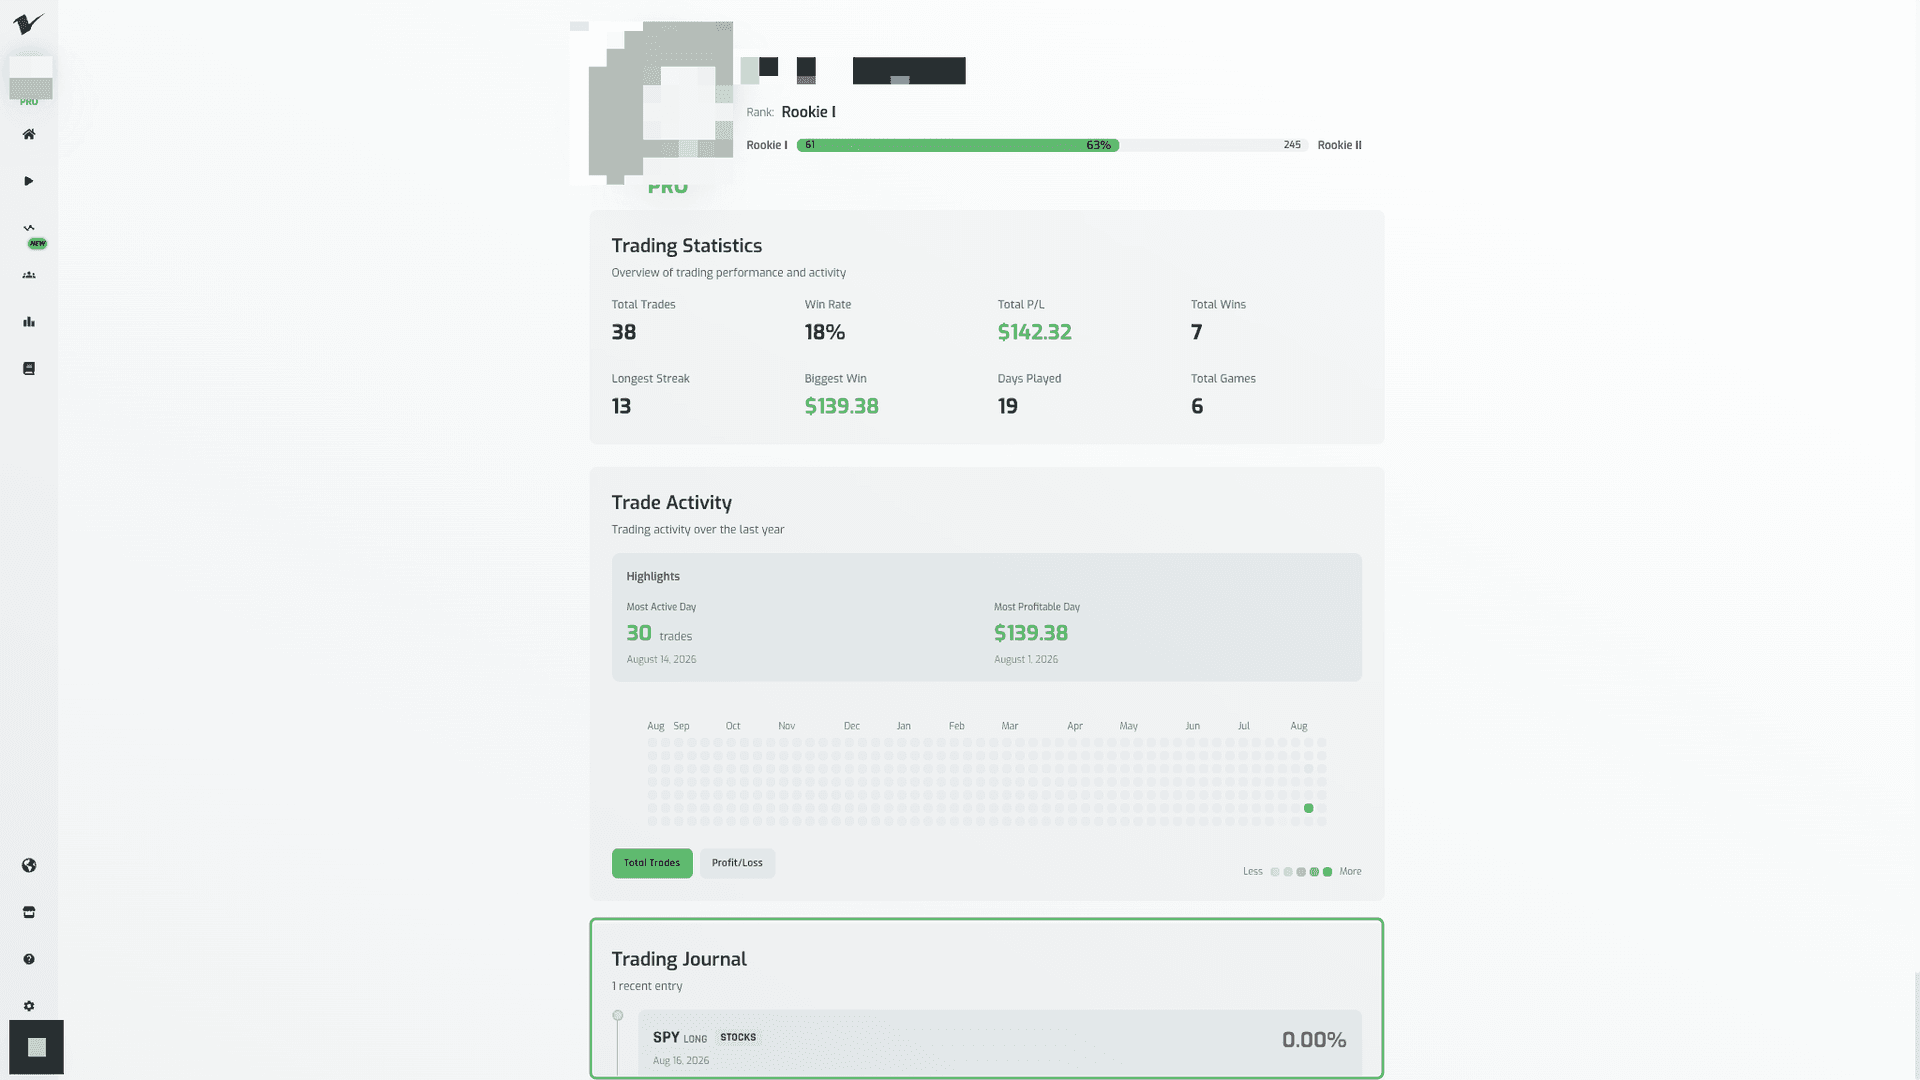
Leaving Publish to Community unchecked keeps the entry private — it stays in your own journal history and never appears on your public profile.
Other users visiting your profile see the same Trading Journal section with only your published entries. Clicking one opens a read-only detail modal showing Summary, Performance, Trade Details, and Strategy — as a non-owner, there's no Edit or Delete action, only Close.
If you'd rather not share any trading activity publicly, go to Settings → Privacy and toggle Public Profile off, then click Save Changes. Other users visiting your profile will then see "This Profile is Private" instead of your stats and journal.
Finding Your Edge with Filters
The real power of Volume's journal is in the analysis, using the stats and filters on the Journal page:
-
Filter by strategy — Select one strategy at a time and compare win rates. If one strategy consistently outperforms another, you know where to focus.
-
Filter by attributes — Select "Disciplined" and check your stats. Then select "FOMO" — the difference shows the cost of emotional trading.
-
Combine filters — Try a specific Type + Indicator together. Is your win rate higher when you use a particular confirmation? The data tells you.
-
Review losers separately — Click Filter Wins through to Losses, then look for patterns. Same strategy? Same time of day? Same emotional state?
The goal isn't to journal for the sake of journaling — it's to generate enough data that patterns become undeniable.
Getting Started
You don't need to fill out every field on your first entry. Start simple:
- Always fill: Trade Summary & Learnings (the reflection)
- Tag honestly: Trade Attributes (the psychology)
- Add over time: Strategy and Market Analysis as you develop consistency, and save a preset once a strategy sticks
The traders who improve are the ones who review. Volume's journal makes it easy — but you still have to do the work.
Your next trade is waiting. Journal it.