Making Your First Trade — Backtesting on Volume
Studies consistently show that 70-90% of day traders lose money. The traders who survive share something in common: they developed their edge through practice before risking real capital.
That's what Volume is for. It's a paper trading simulator that replays real historical market data, letting you compress months of trading experience into hours. Every session drops you at a random point in market history — you don't know when you are, forcing you to develop skills that work across all market conditions.
Let's make your first trade.
Step 1: Understanding Where You Are
When you enter the gameroom, you'll land on a chart at a random point in market history. This randomness is intentional — it prevents you from cherry-picking easy charts and forces you to develop skills that work across different market conditions.
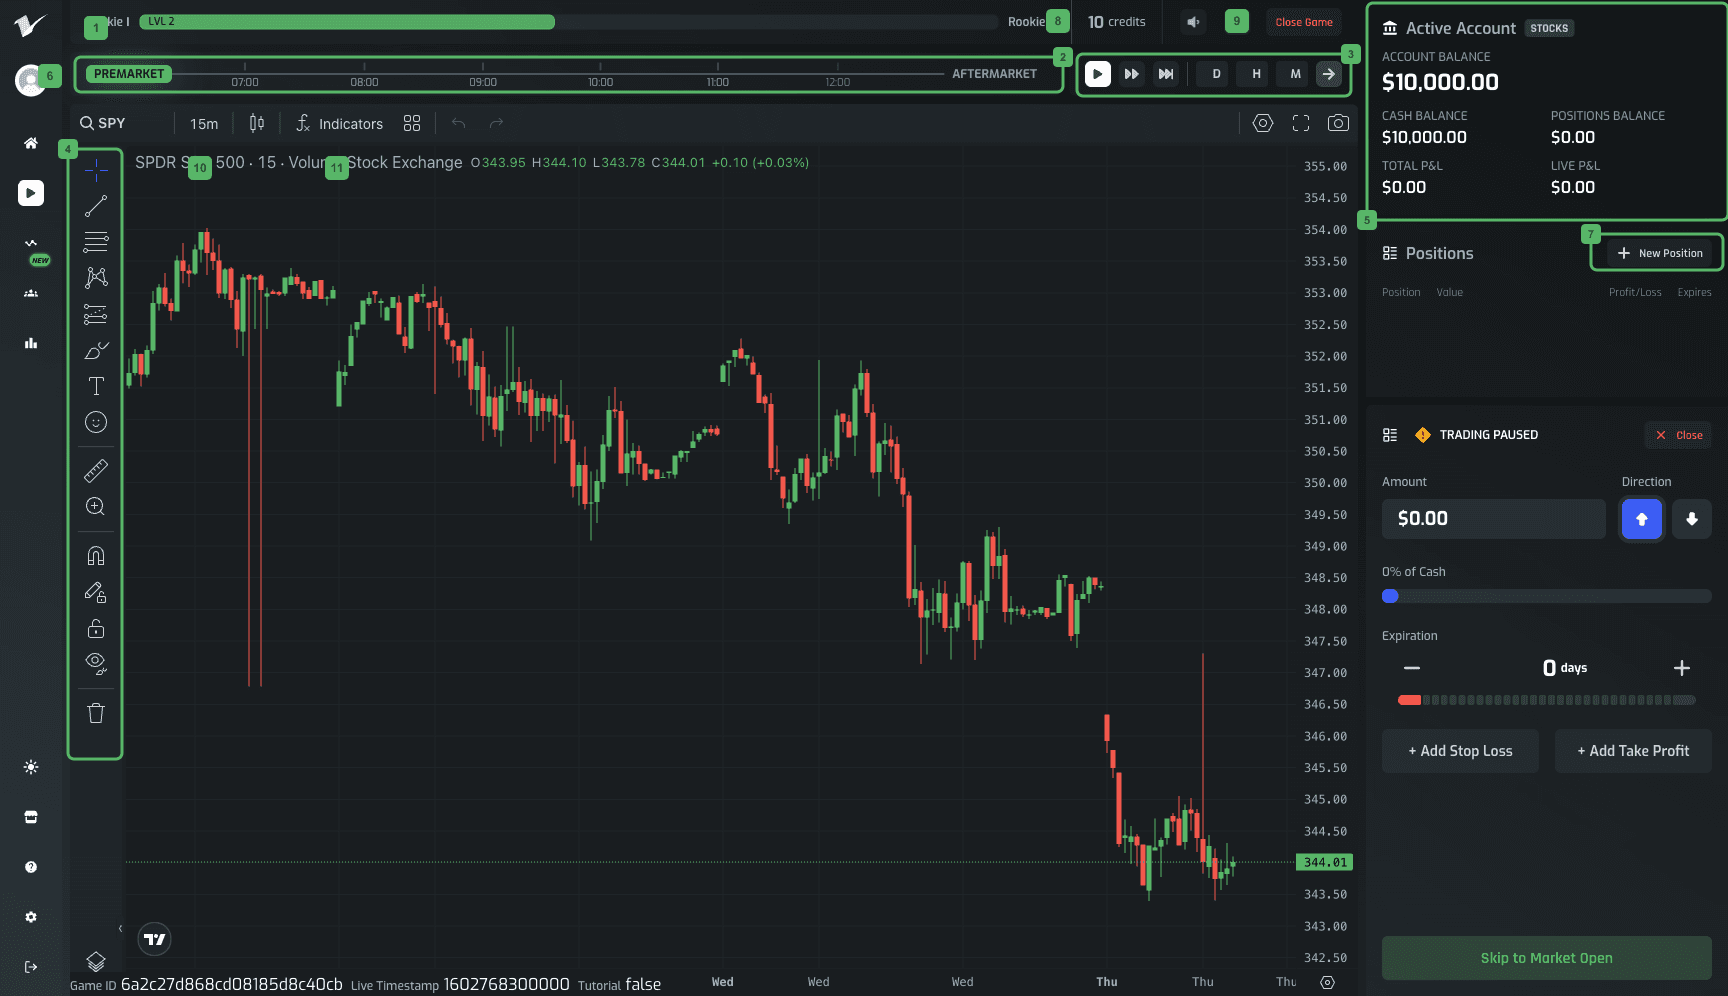
What you're seeing:
- Progress Bar — Your XP and level progression
- Timeline Bar — Visual representation of the trading day with your current position
- Time Controls — Speed controls (1x real-time up to 600x) and skip inputs (H for hours, M for minutes)
- Chart Drawing Tools — TradingView tools for marking support, resistance, and trends
- Active Account Area — Your account balance, cash, positions value, and P&L
- Market Status Badge — Shows whether you're in premarket, market hours, or aftermarket
- New Position Button — Opens the trade panel (only active during market hours)
- Credits — How many trades you have remaining this week
- Close Game — Exit the current session
- Interval Controls — Change chart timeframe (1m, 5m, 15m, 1H, etc.)
- Indicators Menu — Add technical indicators to your chart
Speed hotkeys:
| Key | Action |
|---|---|
| Space | 1x (real-time) |
| Ctrl/Cmd + 2 | 120x |
| Ctrl/Cmd + 3 | 360x |
The first thing to notice is the timeline bar at the top. Trading follows the rhythm of the actual market:
- Premarket (4:00 AM - 9:30 AM ET): The market is closed. You can analyze, but you cannot trade.
- Market Hours (9:30 AM - 4:00 PM ET): The only time you can place trades.
- Aftermarket (4:00 PM - 8:00 PM ET): Market closed again.
A note on time zones: The timeline automatically displays times in your local time zone. If you're in California, you'll see "6:30 AM" when the market opens; if you're in London, you'll see "2:30 PM." The underlying market hours remain tied to U.S. Eastern Time — Volume just translates them so you don't have to do timezone math in your head.
If you land in premarket, use the time to study the chart and formulate a plan. When you're ready, enter hours to skip in the H field and click the arrow to jump forward.
Step 2: Analyze Before You Act
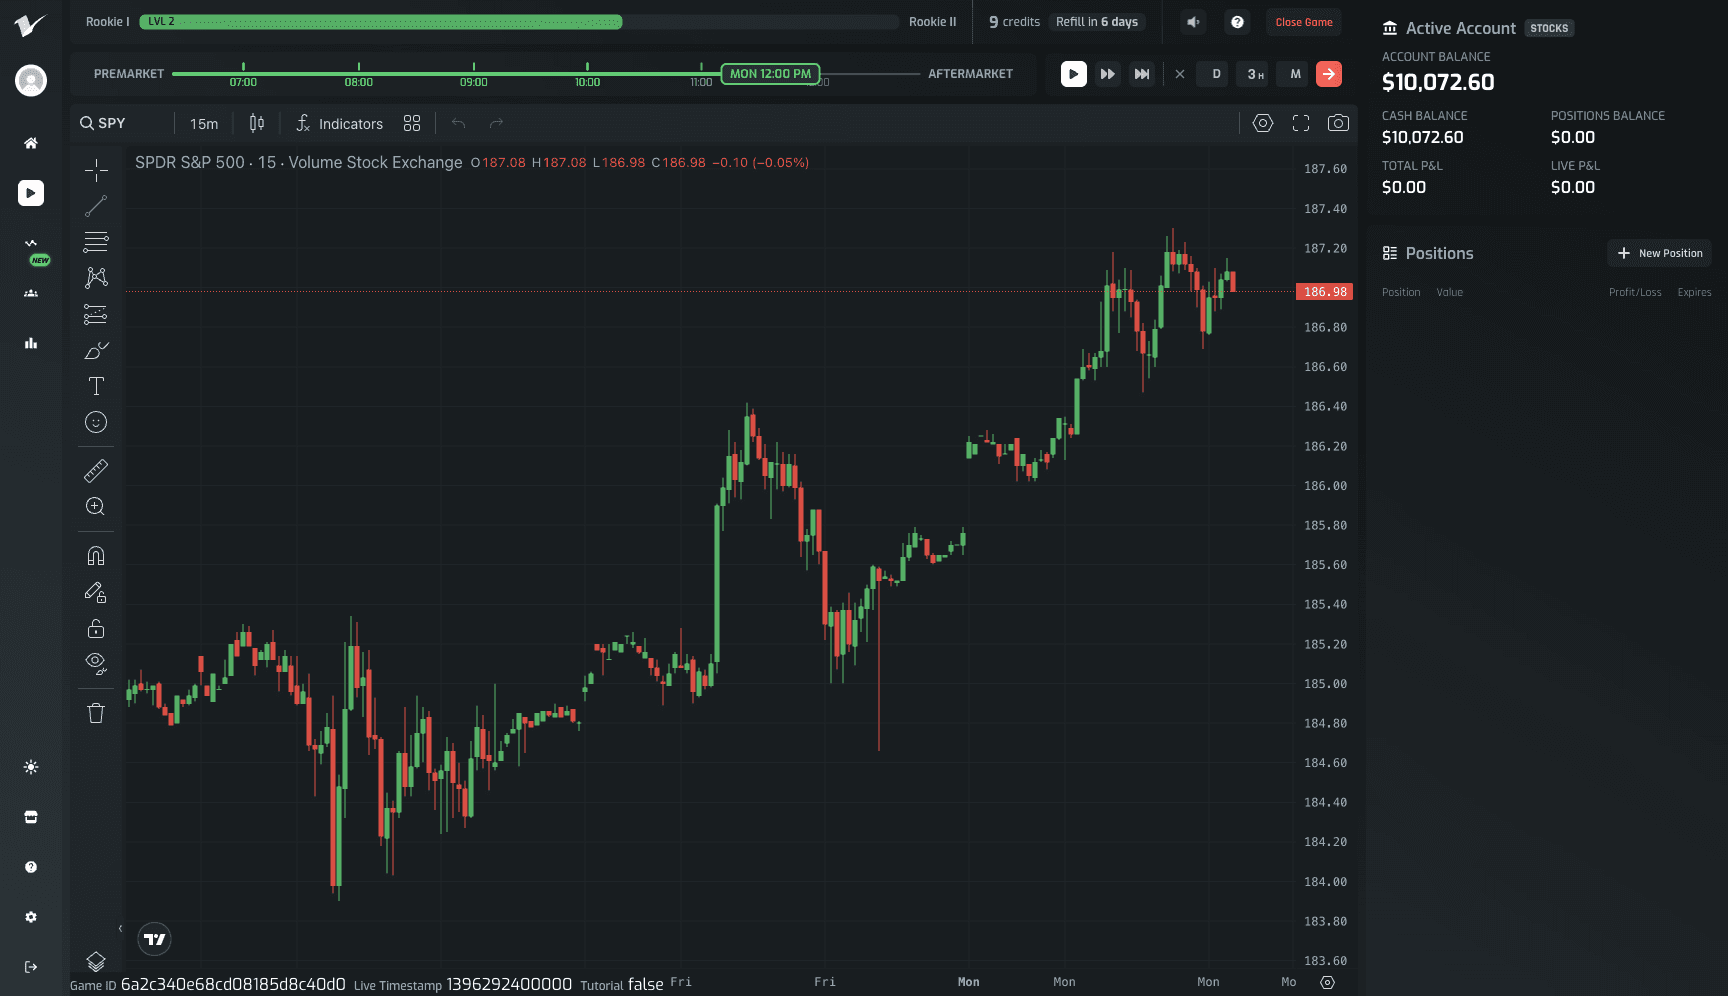
Before entering a trade, ask yourself:
What is the market doing?
- Are prices making higher highs and higher lows? That's an uptrend.
- Lower highs and lower lows? Downtrend.
- Choppy, sideways action? Range-bound.
Where are the key levels?
- Where has price bounced before? That's potential support.
- Where has price reversed down? That's potential resistance.
What does my strategy say?
This is where you apply your own approach. Some traders follow trends. Others fade them. Some wait for breakouts. Others buy at support. There's no single right answer — but there should be a reason behind every trade.
"I think it'll go up" isn't a thesis. "Price is testing support that's held three times, volume is decreasing on the selloff suggesting sellers are exhausted, and my strategy says to buy at support" — that's a thesis.
You won't have a refined strategy on your first trade. That's okay. Volume is where you develop one.
Step 3: Mark Your Levels
Use the drawing toolbar on the left to mark key price levels. Click the trend line dropdown and select Horizontal Line, then click on the chart where price has bounced or reversed.
Drawing hotkeys: (Option on Mac)
| Key | Tool |
|---|---|
| Alt/⌥ + W | Long position |
| Alt/⌥ + Q | Short position |
| Alt/⌥ + B | Rectangle |
| Alt/⌥ + X | Text |
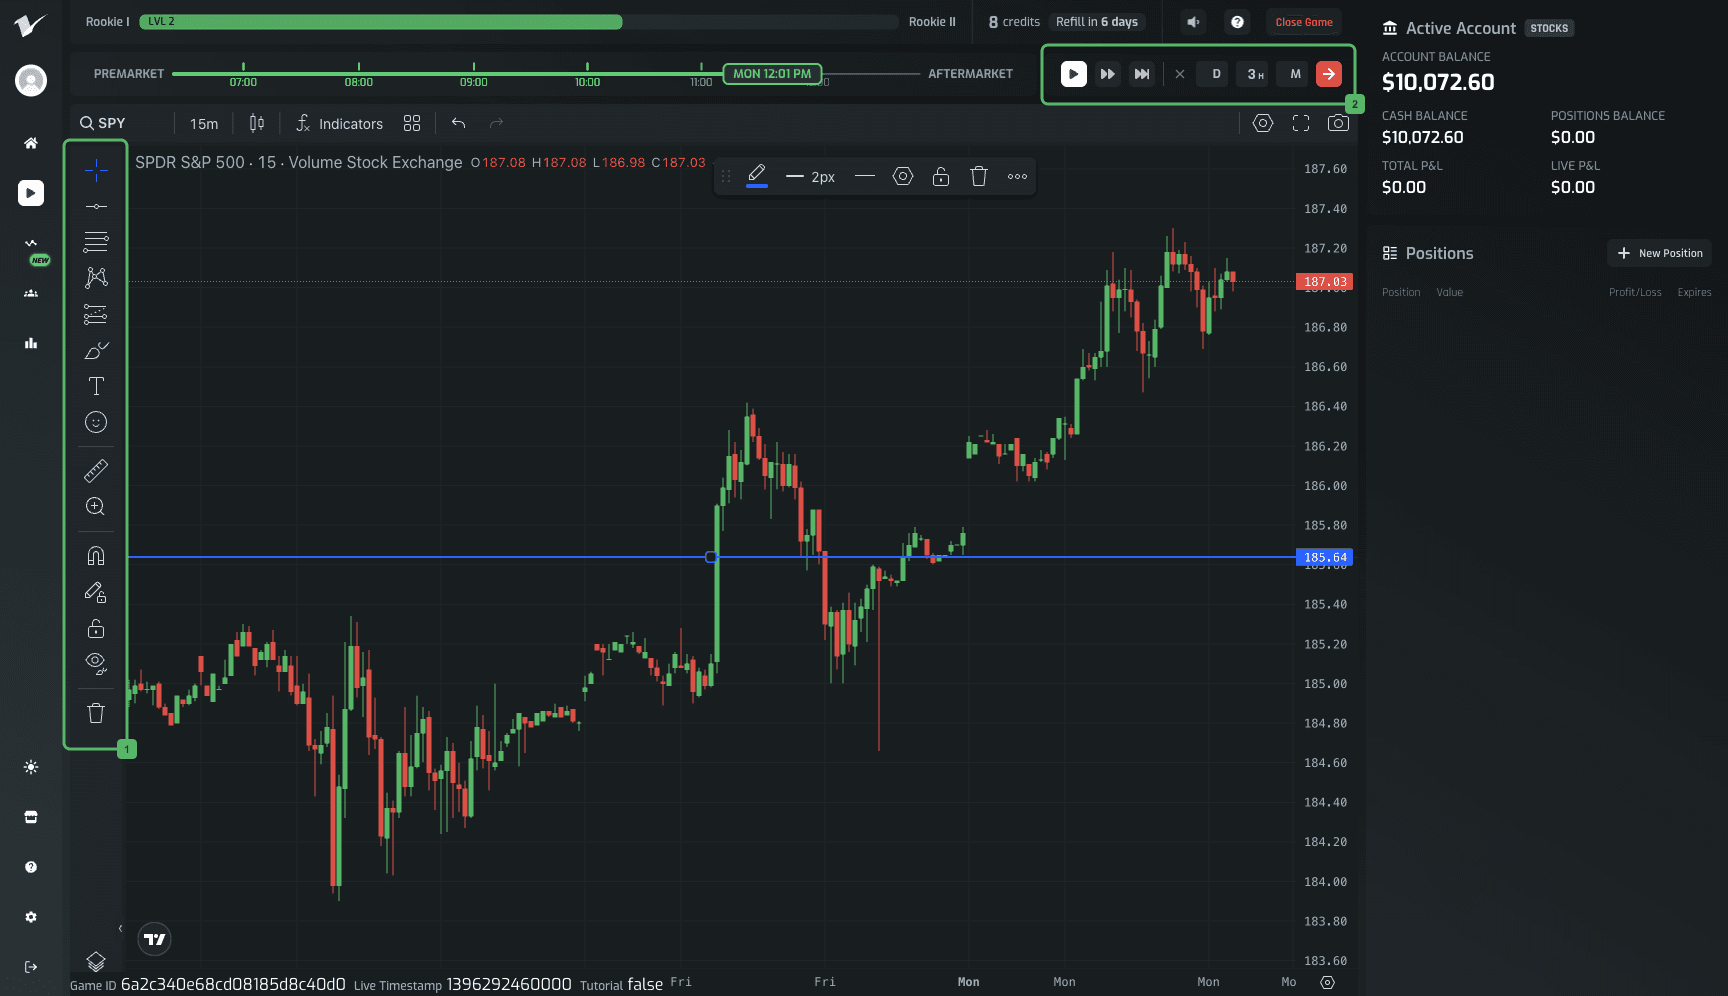
What you're seeing:
- Chart Drawing Tools — Left toolbar for marking levels
- Time Controls — Speed and skip controls to advance time
This gives you concrete reference points: "If price breaks below $185.64, my thesis is wrong and I should exit."
Some traders use many lines, others just a few. Find what works for you — but mark something. Levels turn vague ideas into actionable rules.
Once your levels are marked, use the time controls to advance toward your target entry or invalidation point. Speed up with the hotkeys (Space for 1x, Ctrl+2 for 120x, Ctrl+3 for 360x), the speed buttons, or skip ahead with the H/M inputs.
Step 4: Open the Trade Panel
Click "New Position" in the Positions panel.
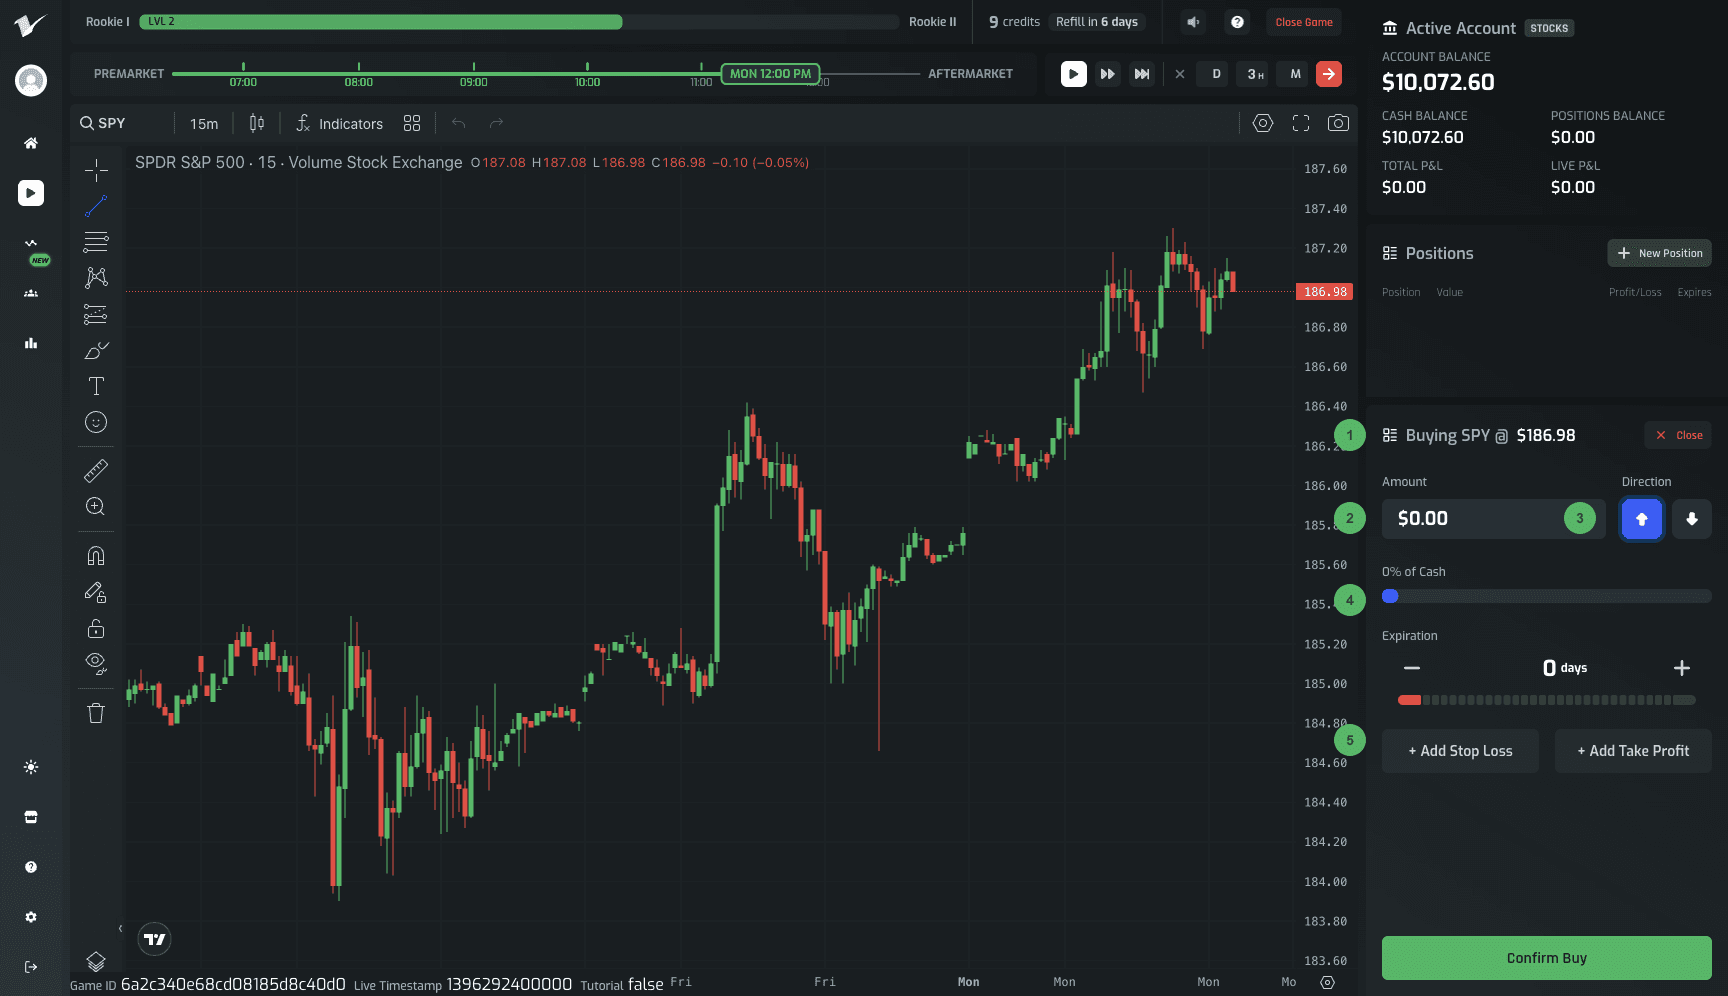
What you're seeing:
- Current Price — The live price you'd pay to enter right now
- Amount Field — How much money to put into this trade
- Direction Buttons — Up arrow (Long) or Down arrow (Short)
- Position Size Slider — Quickly adjust what percentage of your cash to use
- Stop Loss / Take Profit — Risk management tools (we'll add these next)
You'll also set an Expiration — how long the trade can stay open. Shorter expirations increase leverage, risk, and reward; longer expirations are more stable. (Expiration only applies to stocks — futures, forex, and crypto don't have it.)
Position Sizing (2, 4)
Position sizing matters more than entry timing. You can be right 60% of the time and still blow up if you size poorly. You can be right only 40% of the time and still profit if you manage risk.
Standard guidance: never risk more than 1-2% of your account on a single trade.
With a $10,000 account, that means risking $100-200 per trade. Not investing $100-200 — risking that amount. The difference matters.
- $1,000 position with a 1% stop loss = risking ~$10 (0.1% of account)
- $1,000 position with no stop loss = risking the full $1,000 (10% of account)
For your first trades, keep position sizes around 10% of your account ($1,000) with tight stop losses. Room to learn, limited damage.
Direction (3)
Long (Up Arrow): You expect price to rise. Buy now, sell higher later.
Short (Down Arrow): You expect price to fall. Borrow shares, sell now, buy back cheaper later.
If you're starting out, stick with long positions. Shorting adds complexity. Click the up arrow to go long.
Stop Loss (5)
Click "+ Add Stop Loss".
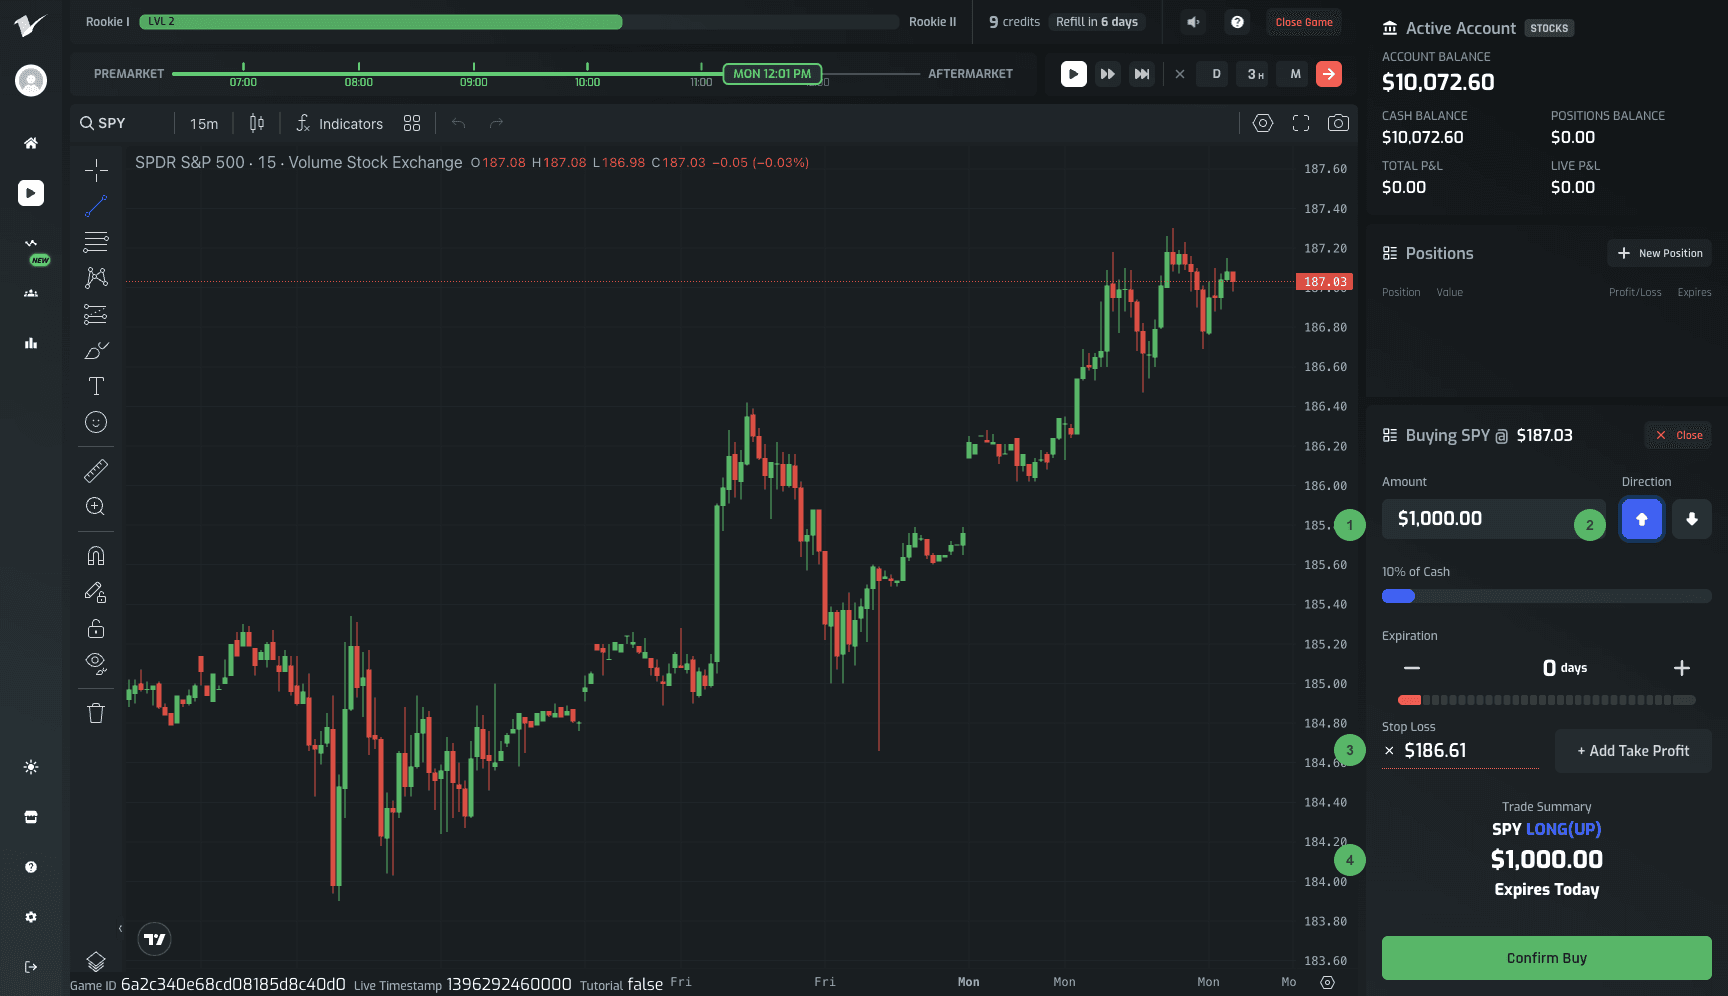
What you're seeing:
- Amount Entered — $1,000 position (10% of the $10,000 account)
- Direction Selected — Long position (expecting price to rise)
- Stop Loss Active — Auto-exit price if the trade goes against you
- Trade Summary — Confirms ticker, direction, amount, and expiration
A stop loss automatically closes your position if price moves against you. The default is about 0.2% below entry — adjust by clicking and typing a new value.
Set it below a logical support level. If you drew that horizontal line earlier, your stop goes slightly below it. If price breaks support, your thesis is wrong and you're out.
Never trade without a stop loss. Traders who blow up aren't the ones who take losses — they're the ones who refuse to take losses until they become catastrophic.
Step 5: Review and Execute
Check the Trade Summary at the bottom:
- Ticker: SPY
- Direction: LONG (UP)
- Amount: $1,000.00
- Expiration: "Expires Today"
Click "Confirm Buy".
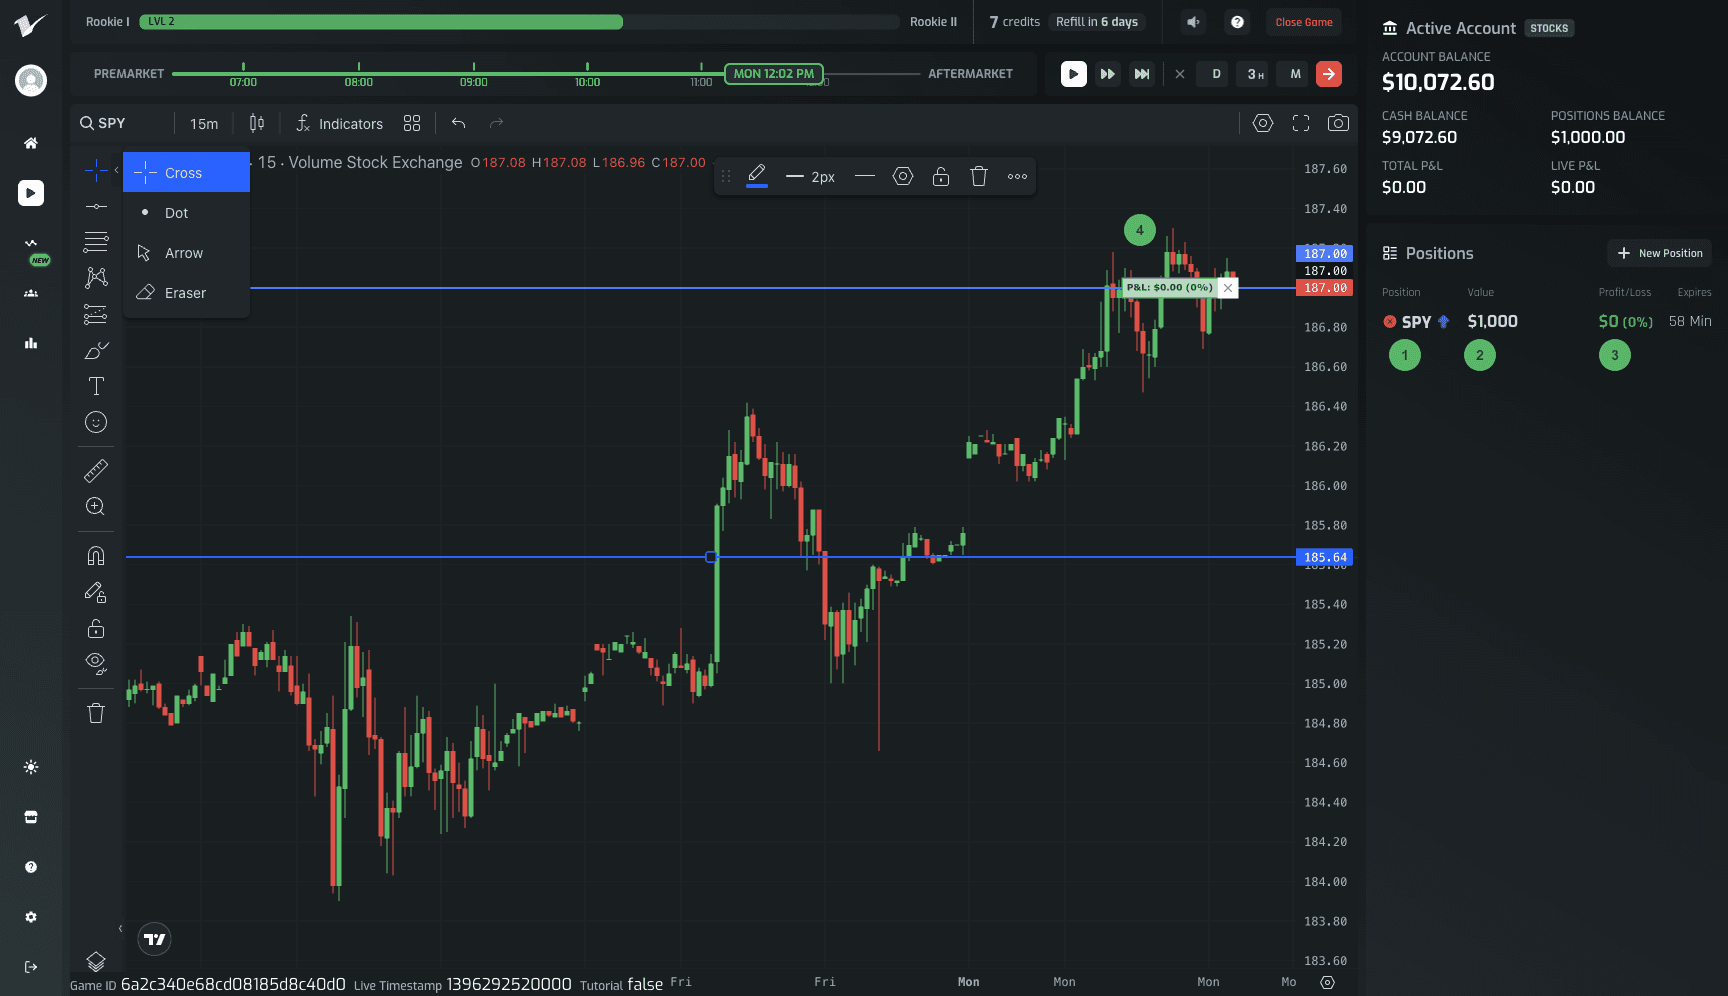
What you're seeing:
- Position Ticker — SPY with direction indicator (green dot = long)
- Position Value — Current value of your position ($1,000)
- Profit/Loss — Real-time P&L and percentage change
- Chart Indicator — Your entry price and current P&L displayed on the chart
One credit deducted. Your position is live.
Step 6: Managing the Trade
Your position is live. Now the psychology starts.
- Do you stare at every tick, or trust your stop loss and walk away?
- Do you move your stop further when price gets close?
- Do you take profit too early out of fear?
If your stop gets hit, let it get hit. Don't move it. A small loss today prevents a large one tomorrow.
If price moves in your favor, consider taking partial profits or moving your stop to breakeven.
Step 7: Closing Your Trade
There are four ways a trade can end:
1. Manual Close (You Decide)
When you're ready to exit — whether taking profit or cutting losses — you have two options:
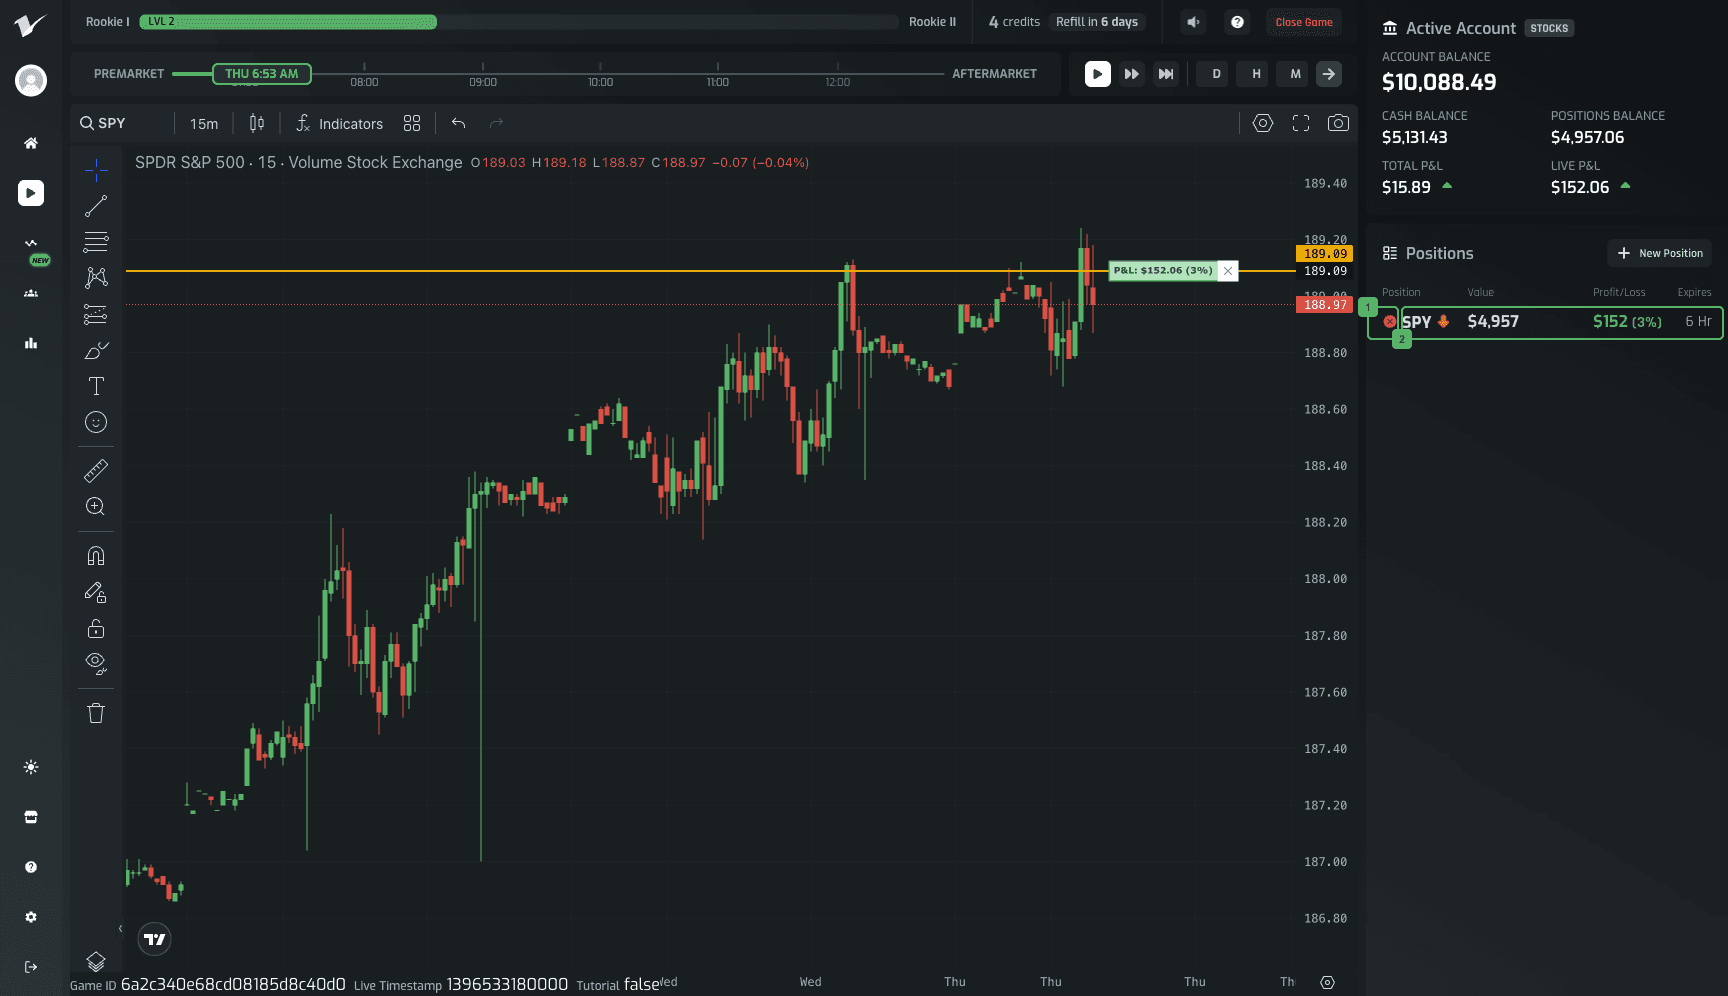
What you're seeing:
- Quick Close Button — Red X icon that instantly closes the entire position at market price (no confirmation)
- Position Row — Click to open the full close panel with options for partial closes and additional stop loss/take profit
Quick Close is fast but final. Full Close Panel gives you more control.
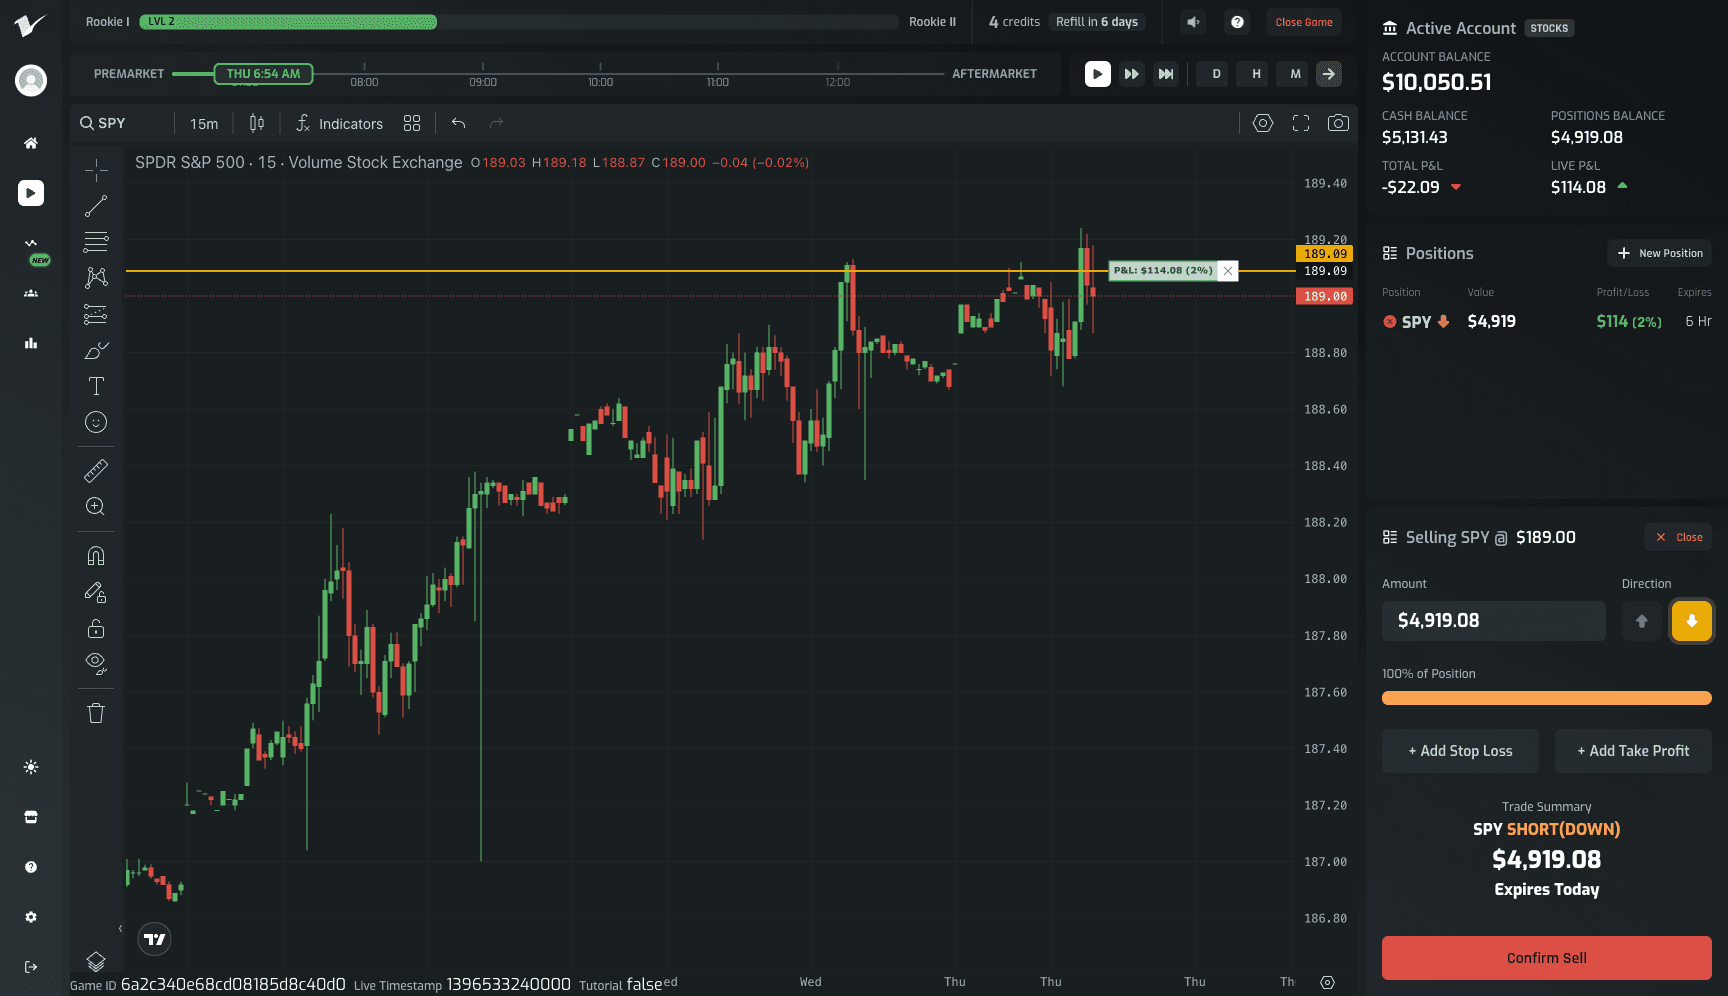
A close panel appears showing:
- The current sell price
- A slider to close all or part of your position (useful for scaling out)
- Options to add stop loss or take profit to the remaining portion
- A trade summary confirming what you're about to do
You can also close directly from the chart by clicking on the entry line — the horizontal line showing your entry price.
2. Stop Loss Triggered (Automatic)
If price hits your stop loss level, the position closes automatically. This is exactly what you want — it means your risk management worked. You'll see the exit marked on your chart and the P&L reflected in your account.
3. Take Profit Triggered (Automatic)
If you set a take profit level and price reaches it, your position closes automatically at that price. This locks in your gains without requiring you to watch the screen.
4. Expiration (End of Day)
If your trade is set to expire today and you don't close it manually, it will automatically close when the market enters aftermarket hours (4:00 PM ET). Volume will warn you when you're 30 minutes out, and again at 10 minutes — it even slows down time acceleration to make sure you don't miss it.
Note: Unlike some real brokerages, Volume doesn't have margin calls or forced liquidations. Your maximum loss on any position is capped at your entry cost — another reason why position sizing matters.
Step 8: Journal Your Trade
After every closed trade, Volume prompts: Do you want to journal this trade?
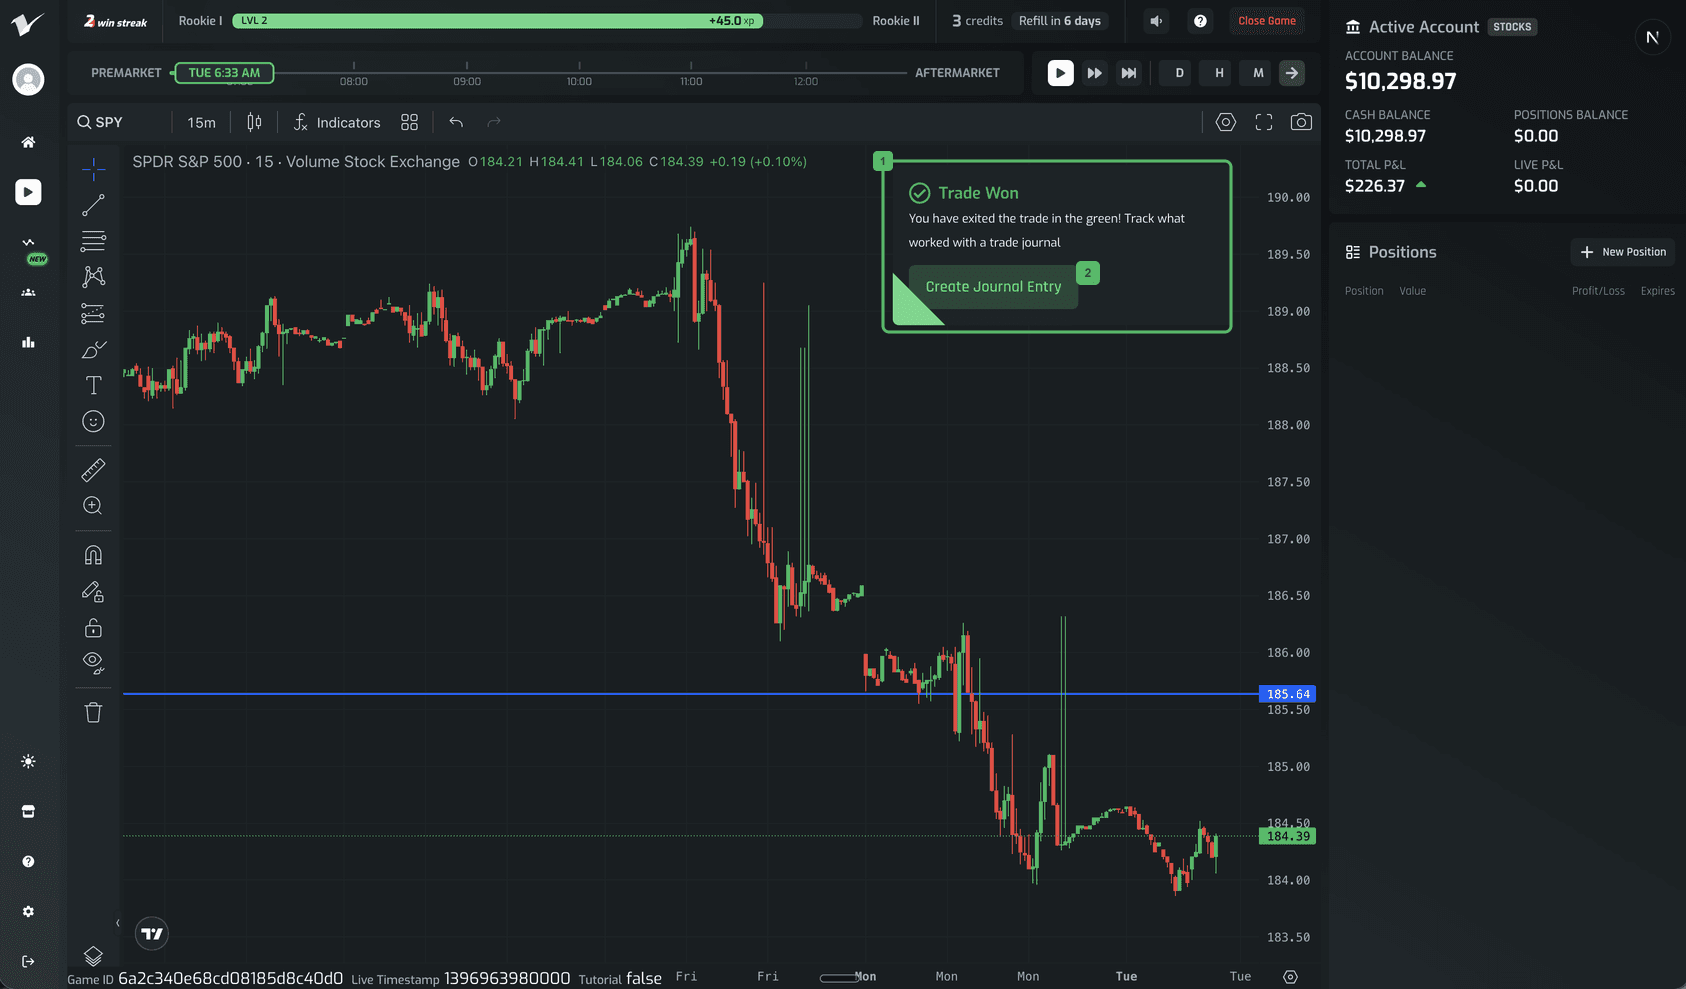
What you're seeing:
- Trade Won/Lost Banner — Summary of your closed trade result
- Create Journal Entry Button — Click to open the journal form with trade details pre-filled
Your trade details are pre-filled. Add:
- Your thesis — Why did you enter?
- What worked or didn't — Was your analysis correct?
- Screenshots — Capture the setup for future review
Journal every trade, especially early on. The traders who improve are the ones who review.
Credits and Pacing
Your first trade cost one credit. Free plan gives you 10 per week — this limit forces you to be selective and avoid overtrading. There are many ways to earn free credits, or go unlimited for $2/month.
After every session, ask yourself:
- What was my thesis?
- Did I follow my rules?
- What would I do differently?
Checklist
- Analyzed the chart before opening trade panel
- Identified at least one support/resistance level
- Clear thesis for entering
- Position size ~10-20% of account
- Stop loss set at a logical level
- Reviewed trade summary before confirming
- Journaled the trade